What are we laboring for?
When we talk about people “working,” what does it all mean?
Work seems such a central part of life, when it could be seen as more of a phase.
Because in terms of any given day, “working” is only a condition for a portion of the population.
In fact, the first point to make here is, on any given day, most people are not working.
Why does it matter? Well, for one, we call it the workweek. Five days of reality out of every seven are, in general terms, dedicated to work. So when you see a traffic jam, it is easy to mistake it for the whole world trying to get to work at the same time, but the reality is that the working world is just part of the story and that school only covers part of that remainder.
Not everyone is participating in a five day a week grind.
It is more important to note than it would seem too, because in general, working people can be judged and treated quite harshly despite the active and critical role they play in our society.
Most easily seen in the case of single parents, society does not account for the way the economic load lands on many people’s shoulders.
People working are actively trying to make a living, where “making a living” is shorthand for having the money to maintain a livelihood, where we are literally talking about roofs over heads and food on tables.
It lies in stark contrast to “living,” and in fact lies in opposition to life, because the truth is many people are not successfully making a living within our economy.
No one wants to talk about that however, so we act like the unemployment numbers are telling us something when the real situation is far more wide-spread and nuanced.
To illustrate this better, let’s get some numbers on the board:
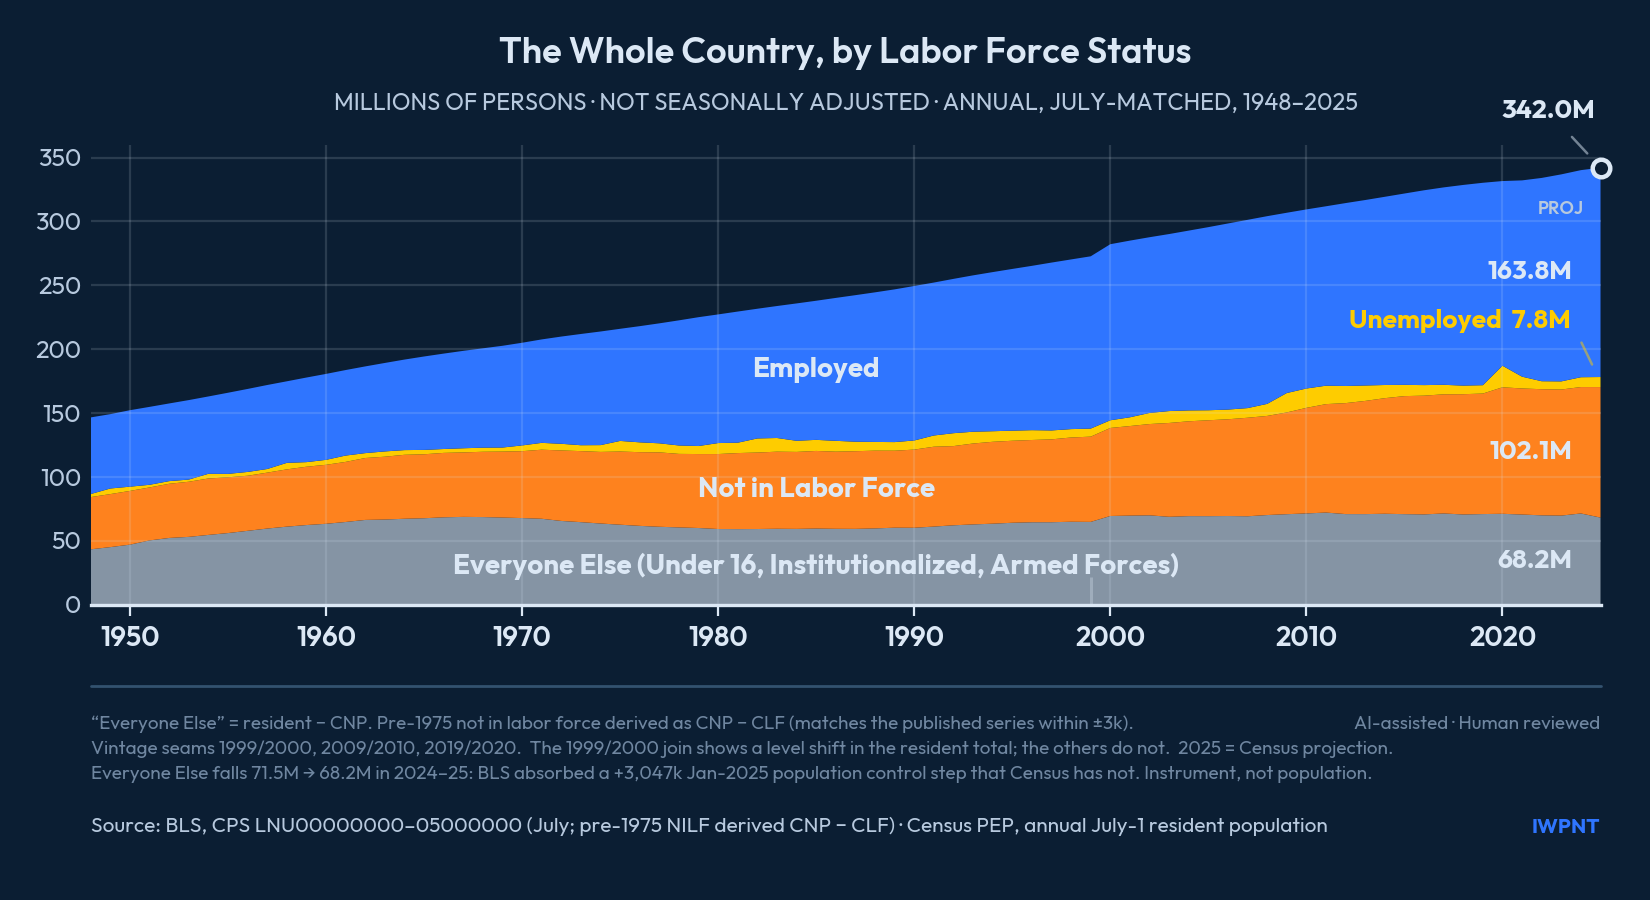
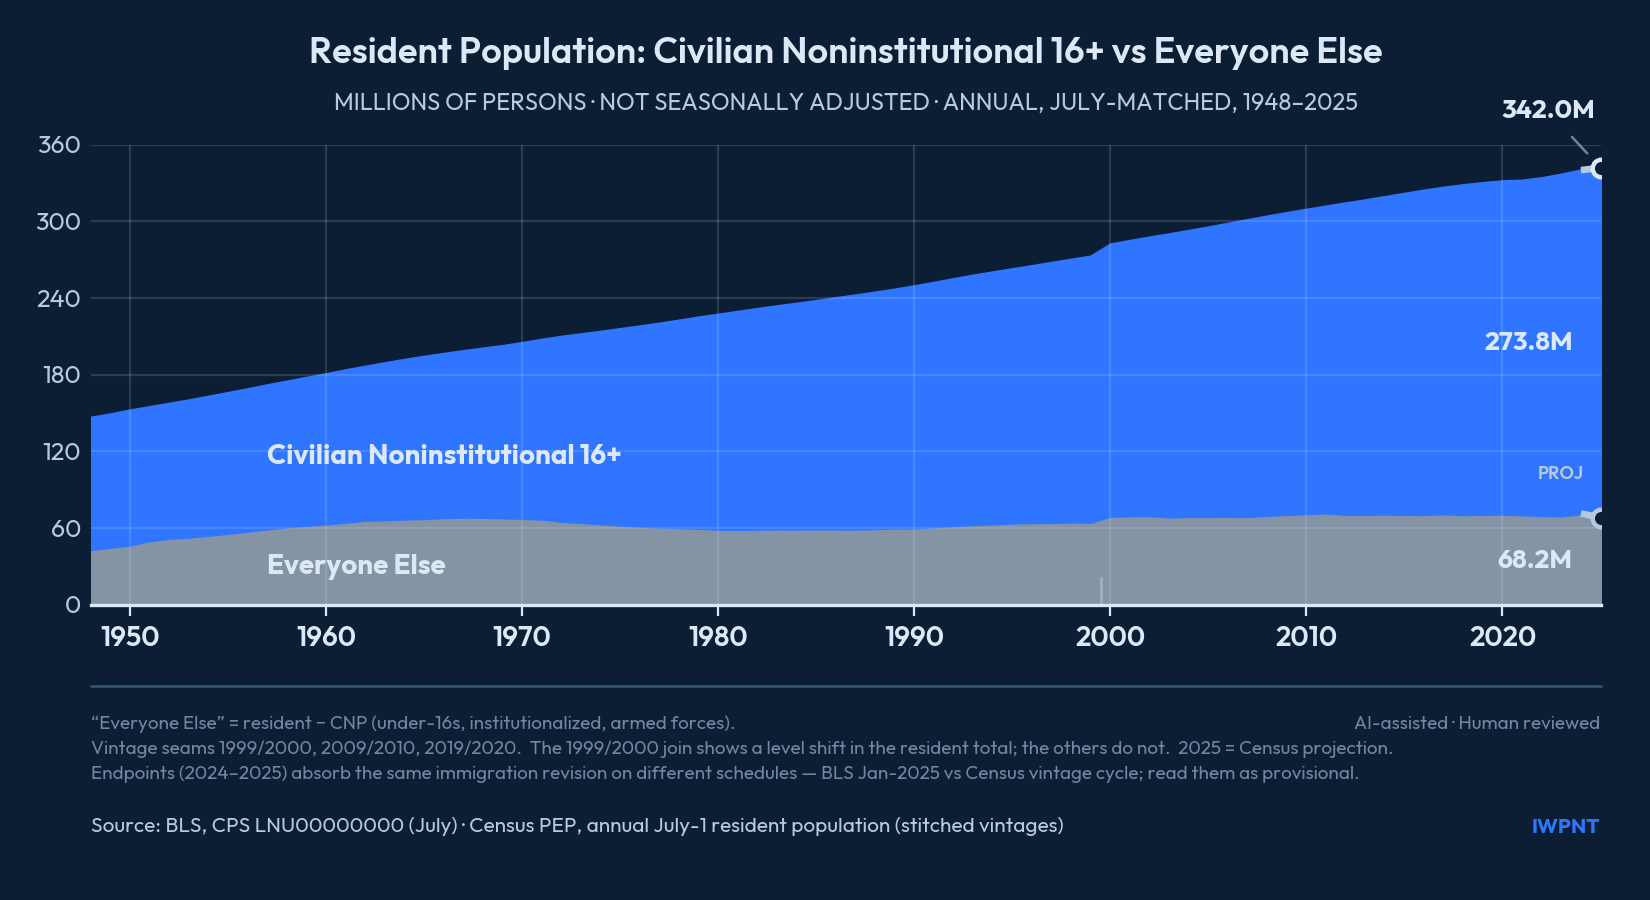
Employment stats are usually only presented within the bounds of the Civilian Noninstitutional Population, but by including the entire population in our view, we can clearly see that the Employed are slightly outnumbered by the “Non-employed.”
But let’s make that even clearer with the percent shares:
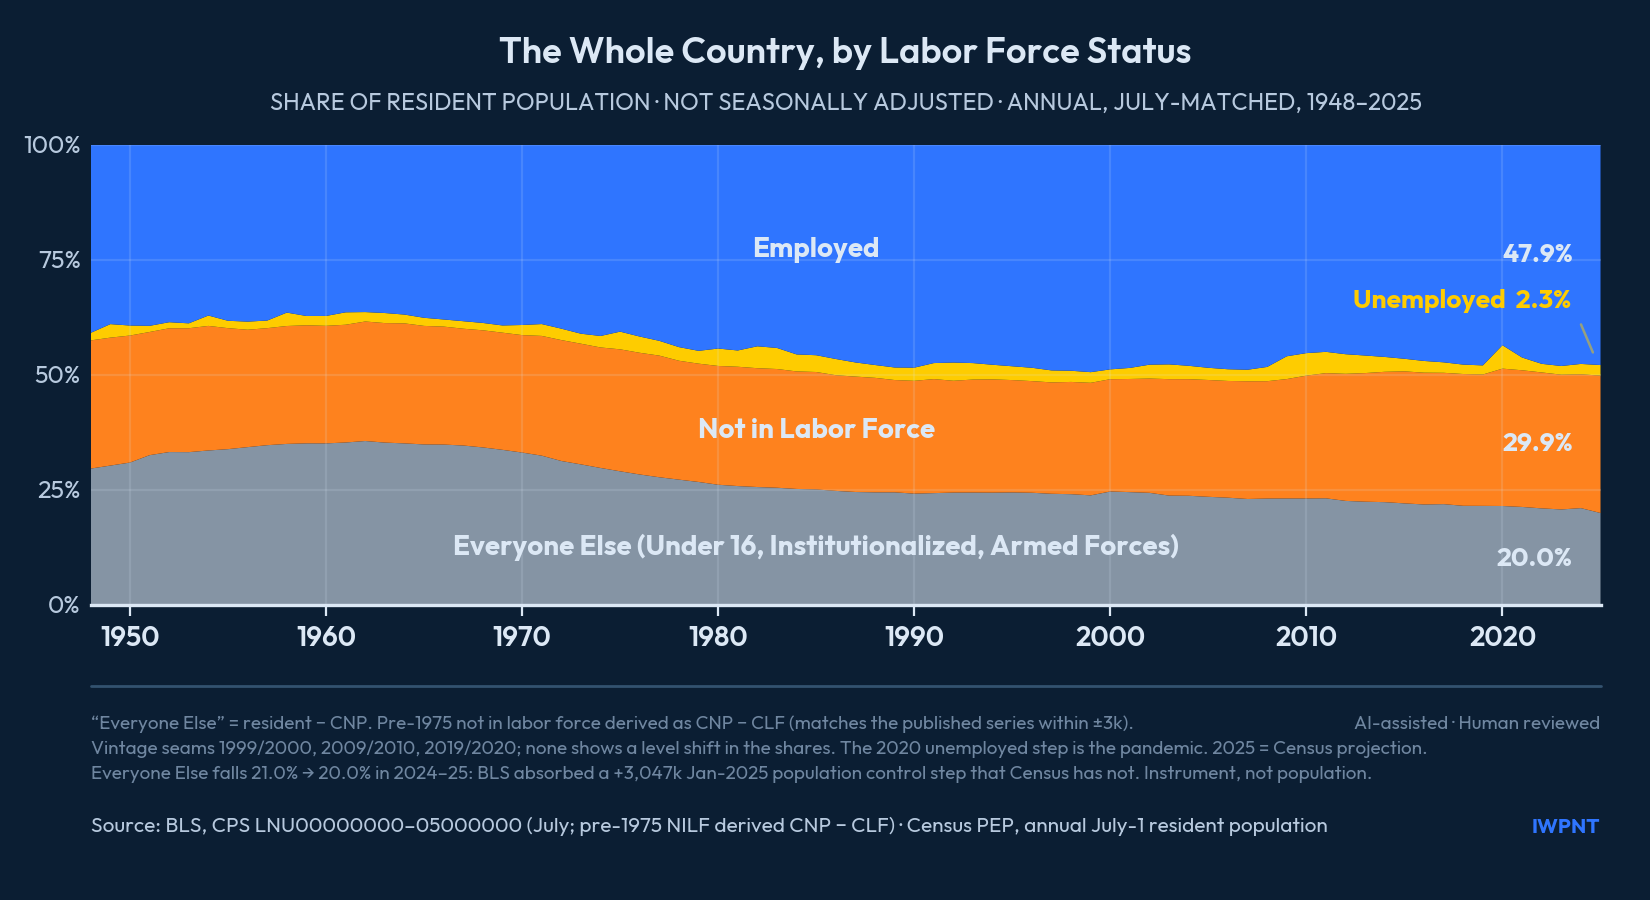
Now the concept of “making a living” becomes a little more complex.
Who are all these people not working and how are they getting away with it?
Kids and the retired are in that number, but to what degree?
Put another way, how many people not working are depending on someone Employed to make their living for them?
Those answers await us when we get to household data, where reality really begins to take shape.
For now, let’s focus on this Employed lot:
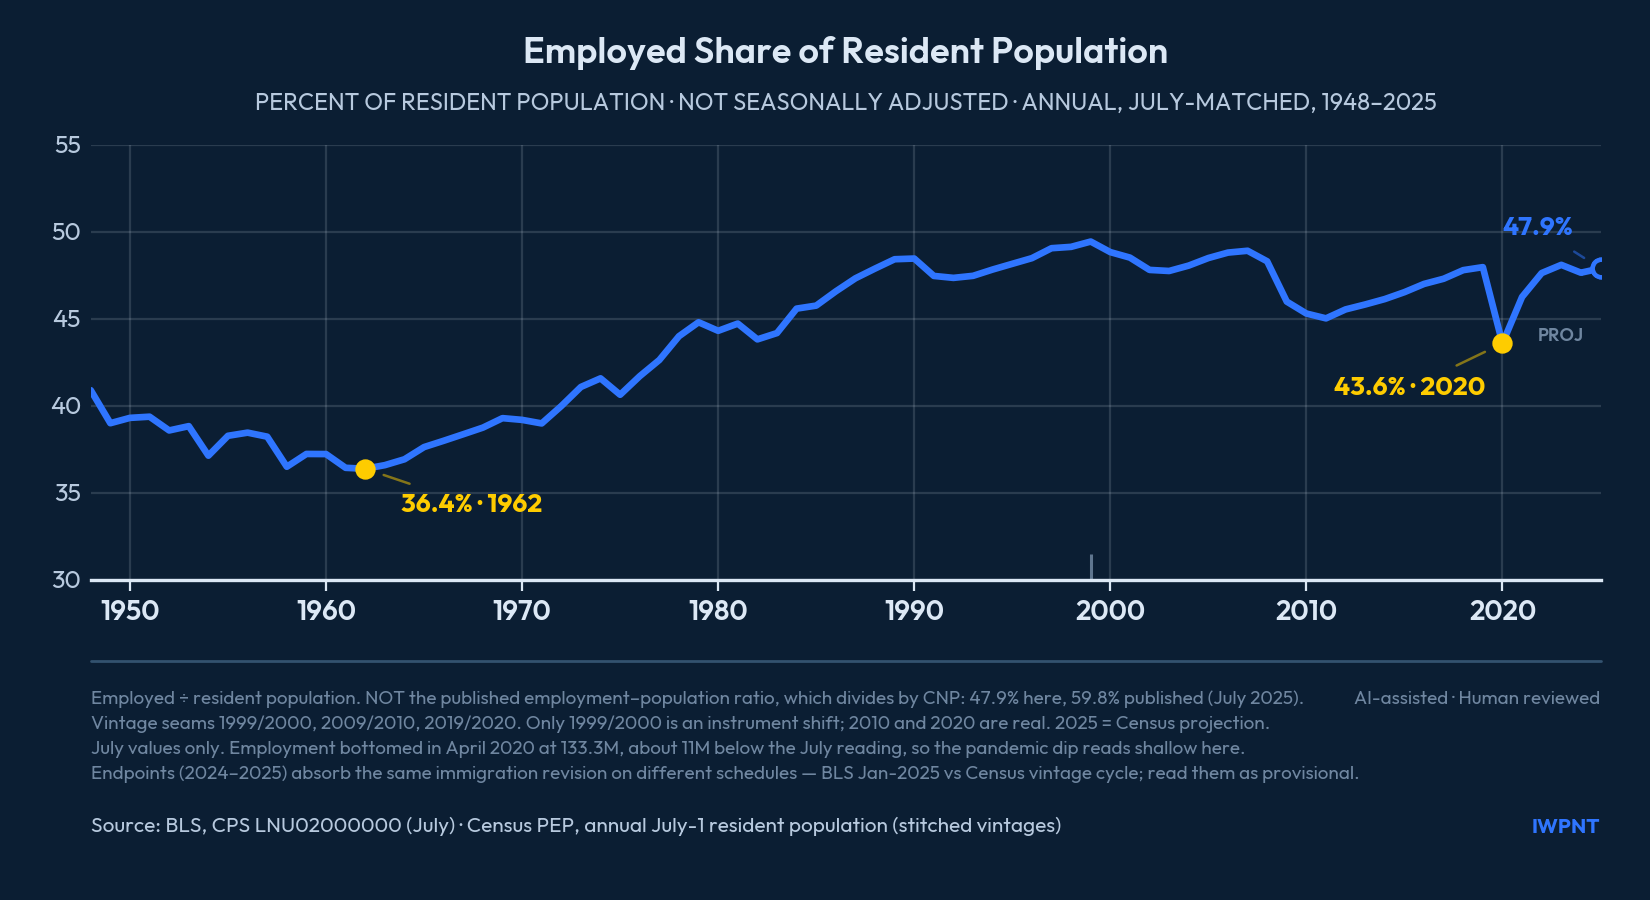
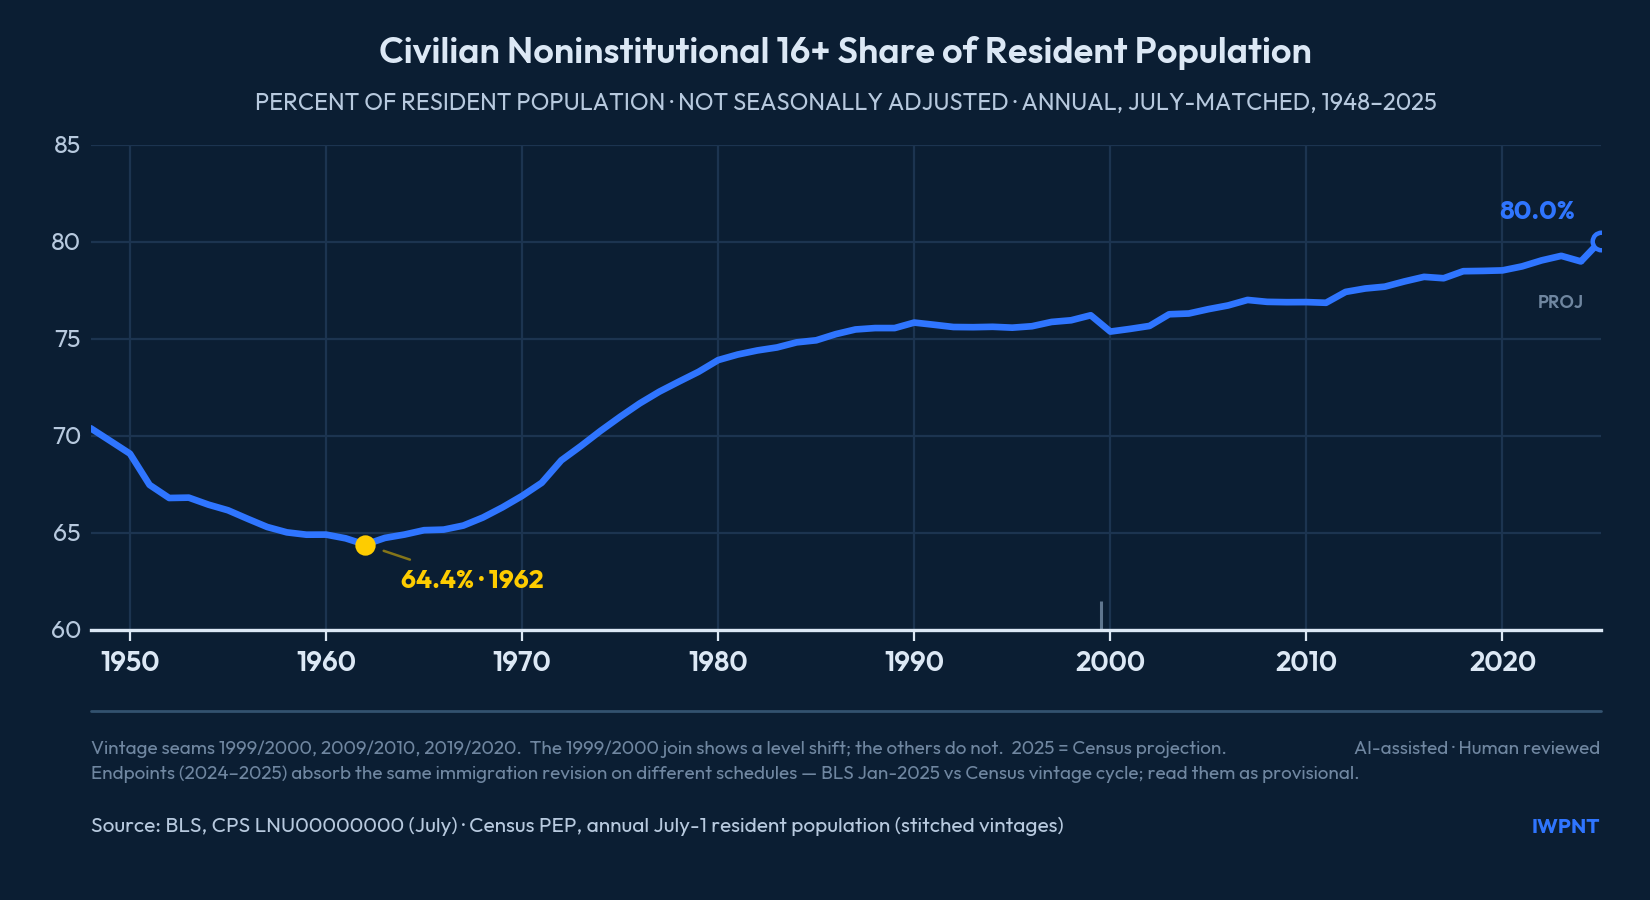
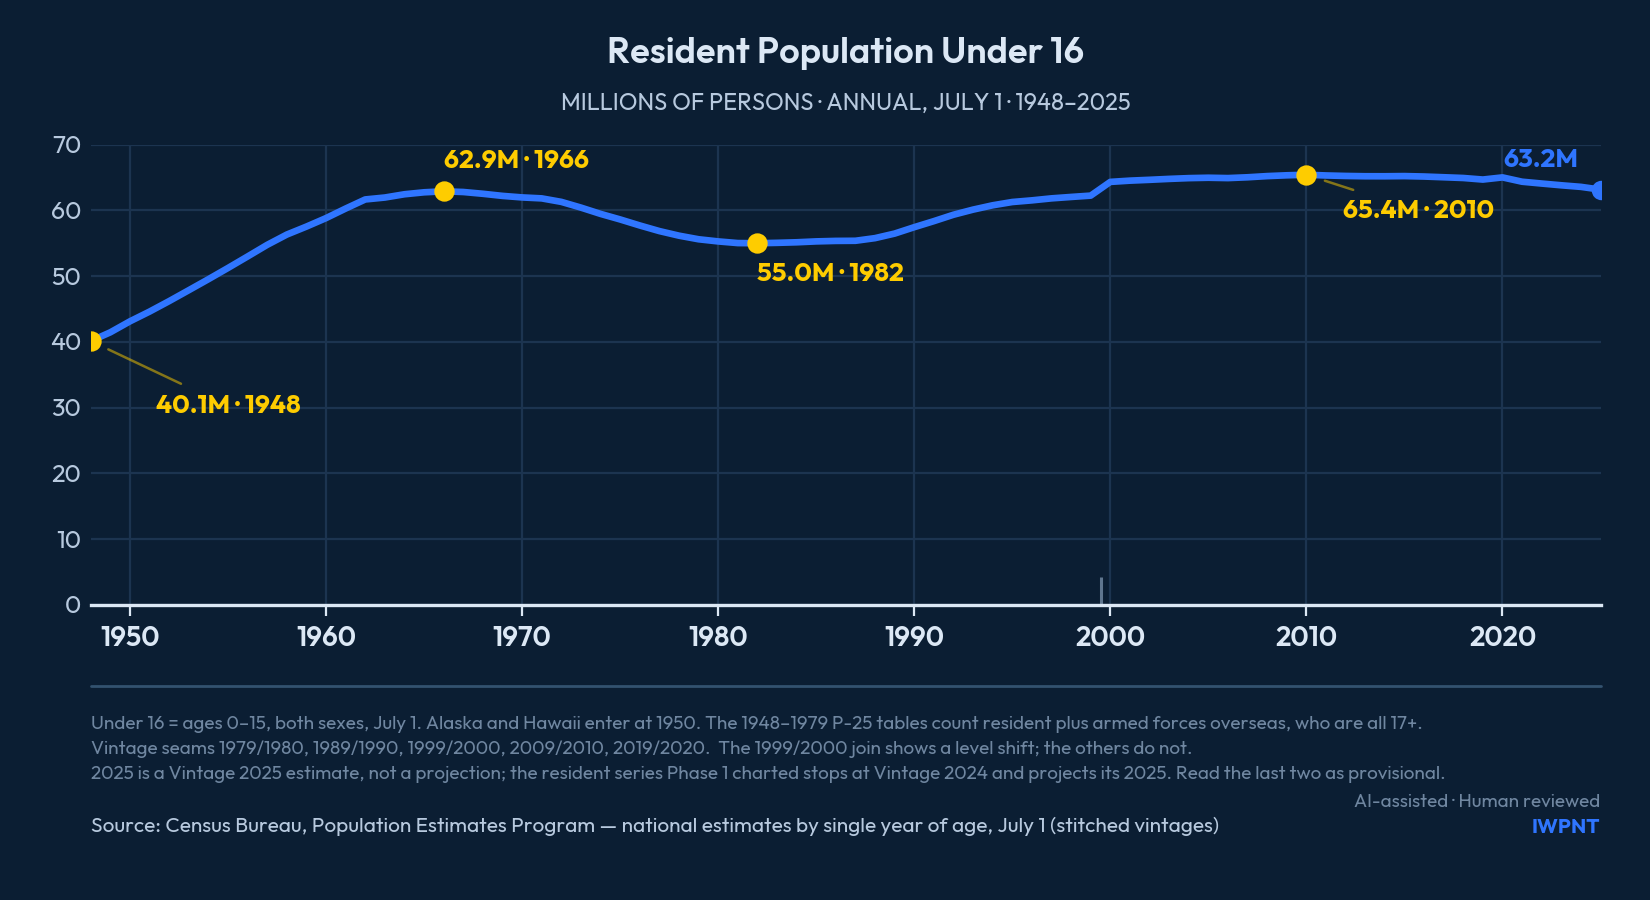
So in thinking about the difference between now and the 1960s, the proportion has gone from roughly ~35% Employed, ~35% Kids, ~30% Other to ~50% Employed, ~20% Kids, ~30% Other.
Oh how our demographics have churned.
We are creating fewer participants for the future while more of our present stock is stuck working.
It doesn’t feel like a brighter future.
My general thesis is that our civilization is operating without a point and therefore our lives become afterthoughts in the wake of those driven to “win.”
We aren’t trying to make great lives possible, we just pass on the outlandish notion that everyone can do it on their own despite conditions making it increasingly difficult for both individuals and families to make ends meet.
Things aren’t what they seem at all, and yet we call it the news and then call it a day, setting up nothing but more of the same for tomorrow.
For the moment though, let’s let those proportion sink in. That’s the world we live in now.
The next step will be dissecting the wild variations among the “Employed,” for it is a range of opportunities being presented and a wider range of outcomes, which is where so many of us fall through the cracks.